We have a tool for examining the frequency content (the spectrum) of our recording and we have the normal wave plots for examining how our recording evolves over time. Is there a possibility to combine these features, in order to study how the frequency content evolves over a period of time? Actually, Acoustica features two ways of displaying so called time-frequency plots. The spectrogram and the wavelet transform (based on the Morlet class of wavelets for the advanced reader). They differ mainly in the frequency scale. The spectrogram has a linear frequency scale whereas the wavelet transform has a logarithmic frequency scale.
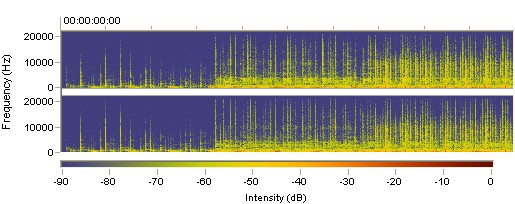
A spectrogram generated by Acoustica. The vertical axis represents the frequency, the horizontal represents time.
You can adjust the resolution and the color representation in both the spectrogram and the wavelet transform in the Preferences dialog box (see Changing the Preferences).